Trend Surface of Biophysical Factors
Digital Elevation Model and Point Data
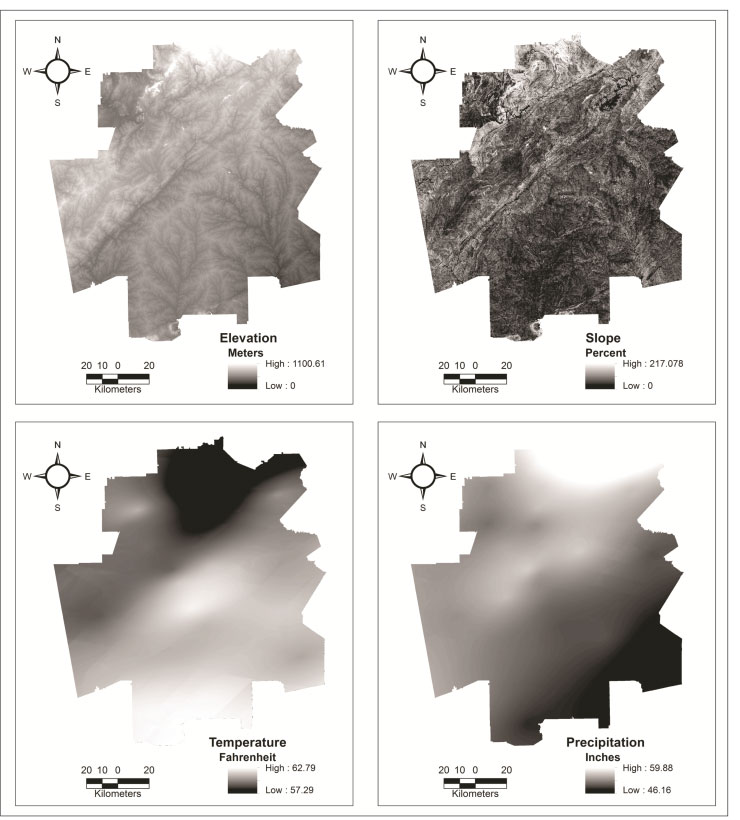
The elevation, slope, average temperature and precipitation surfaces are shown on the map. The slope map was derived from digital elevation model. The temperature and precipitation surfaces were interpolated using values from point data.